Case Study
University of WorcesterThis real-life example is a special one. Our first alpha test which showed, instantly, the power of this tool. Conducted among our students and colleagues.
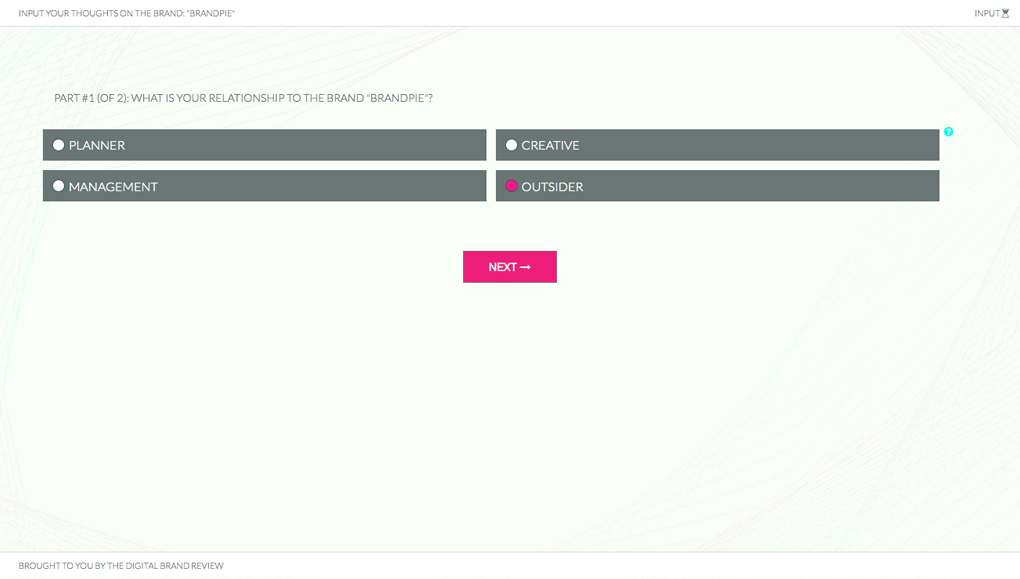
First, you need some input from humans
The first question defines your group
Subjects were shown or sent a private link to the survey.
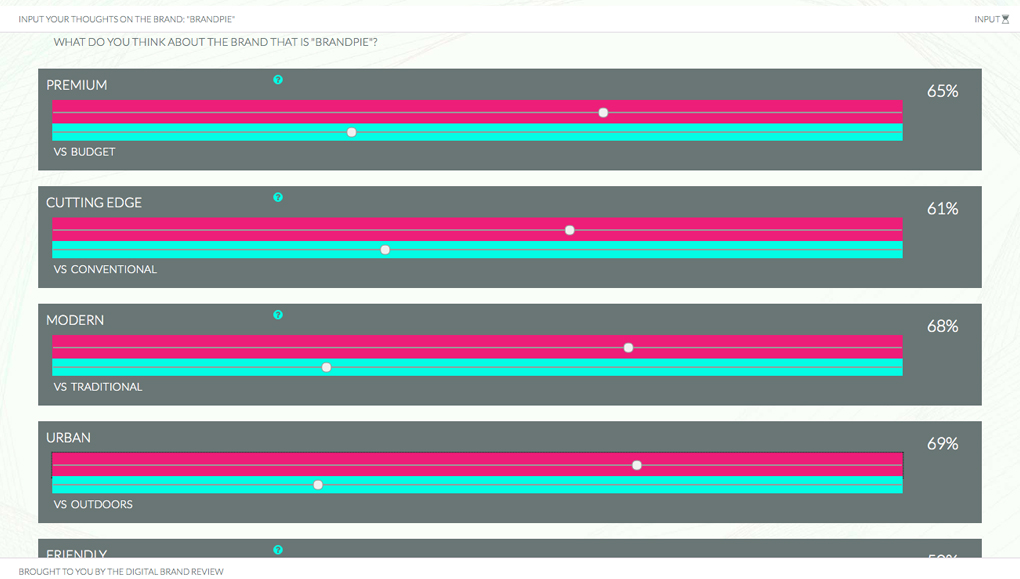
The second are our series of "Binary Attributes"
These 9 sliders define what you feel about the brand in question. There is minimal guidance and users are prompted to make a gut-feel answer.
Now it comes to viewing the results
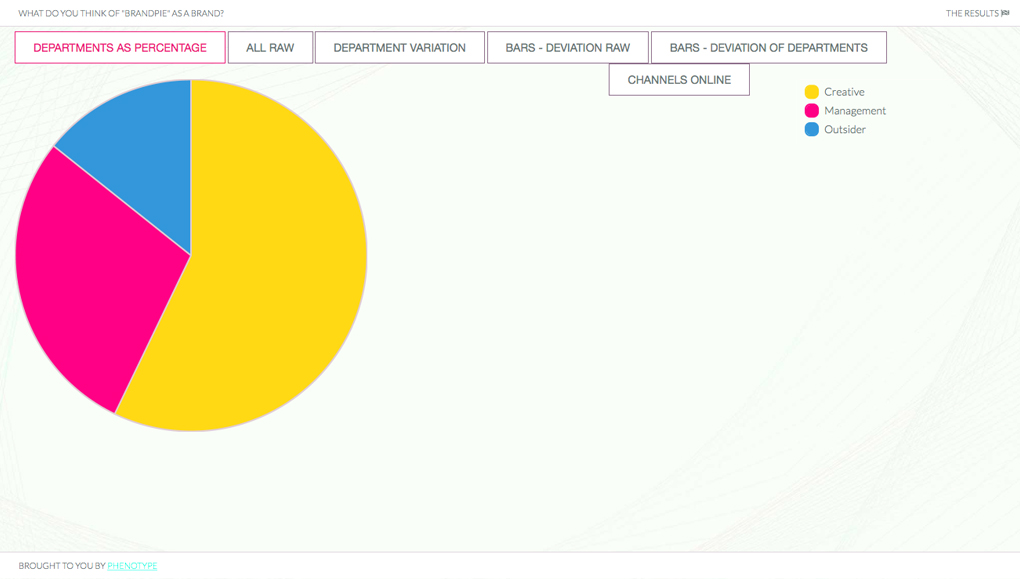
First we see a breakdown of entries
All results are anonymous, and stored via group or department.
Now we can see the raw results
These are the binary attributes as entered by your users. This constitutes the only data we use. The raw result shows, well, a mess.
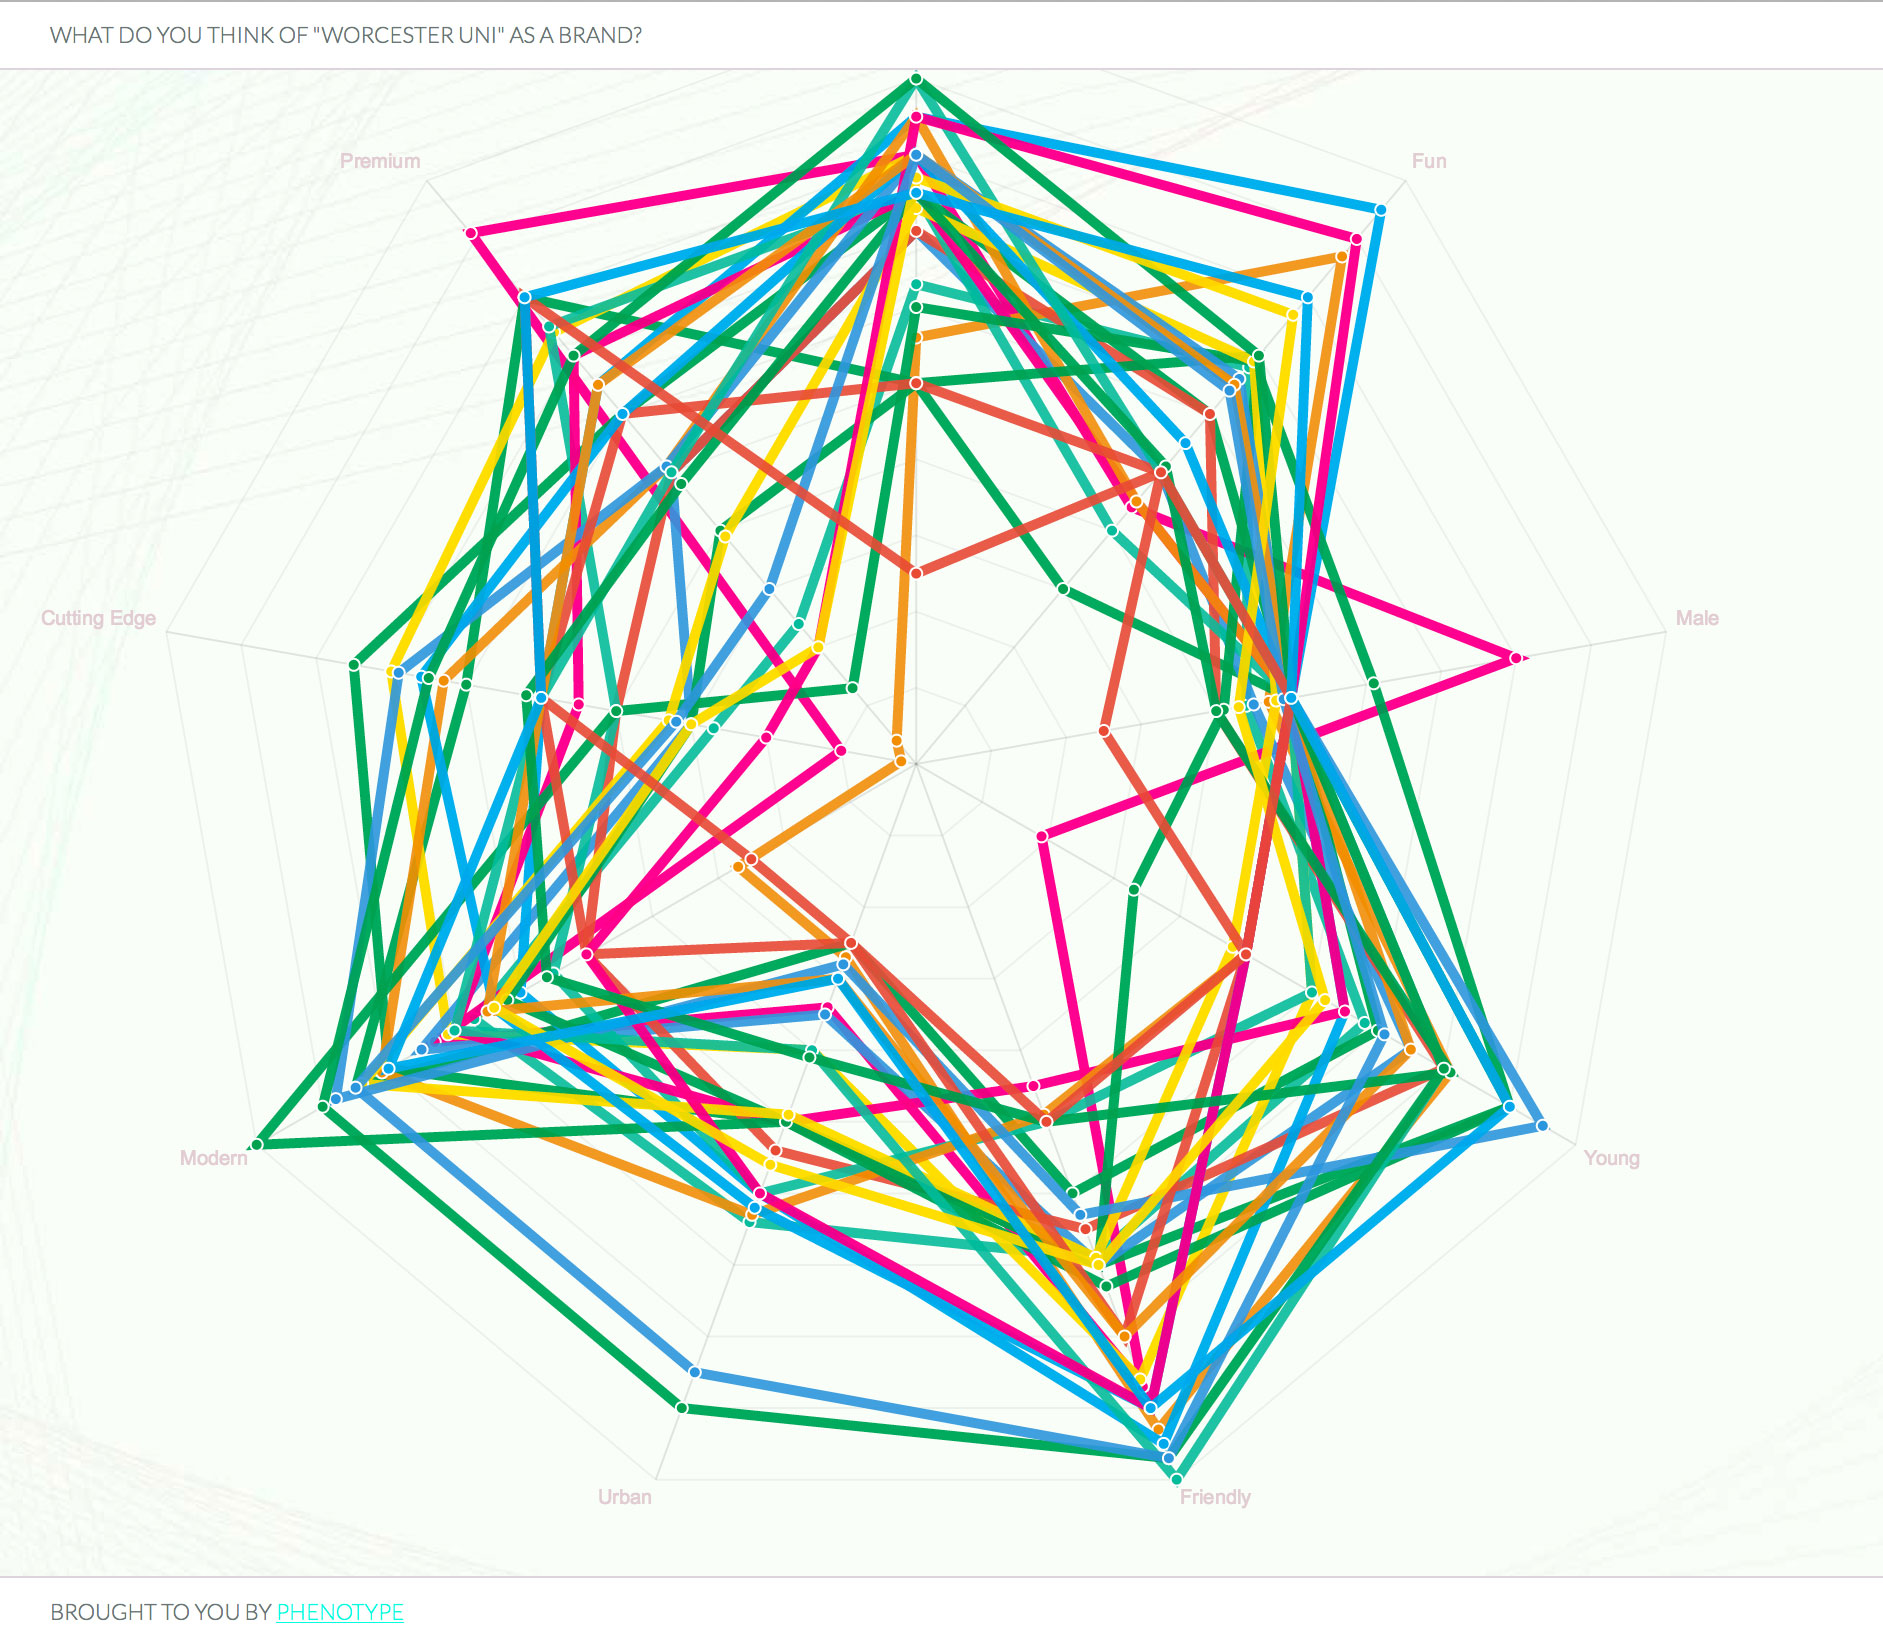
Then we show the same by group
Now things start to get interesting. We create the average value for each group and overlay these. In this case you can see an agreement on all bar a few values among academics and students.
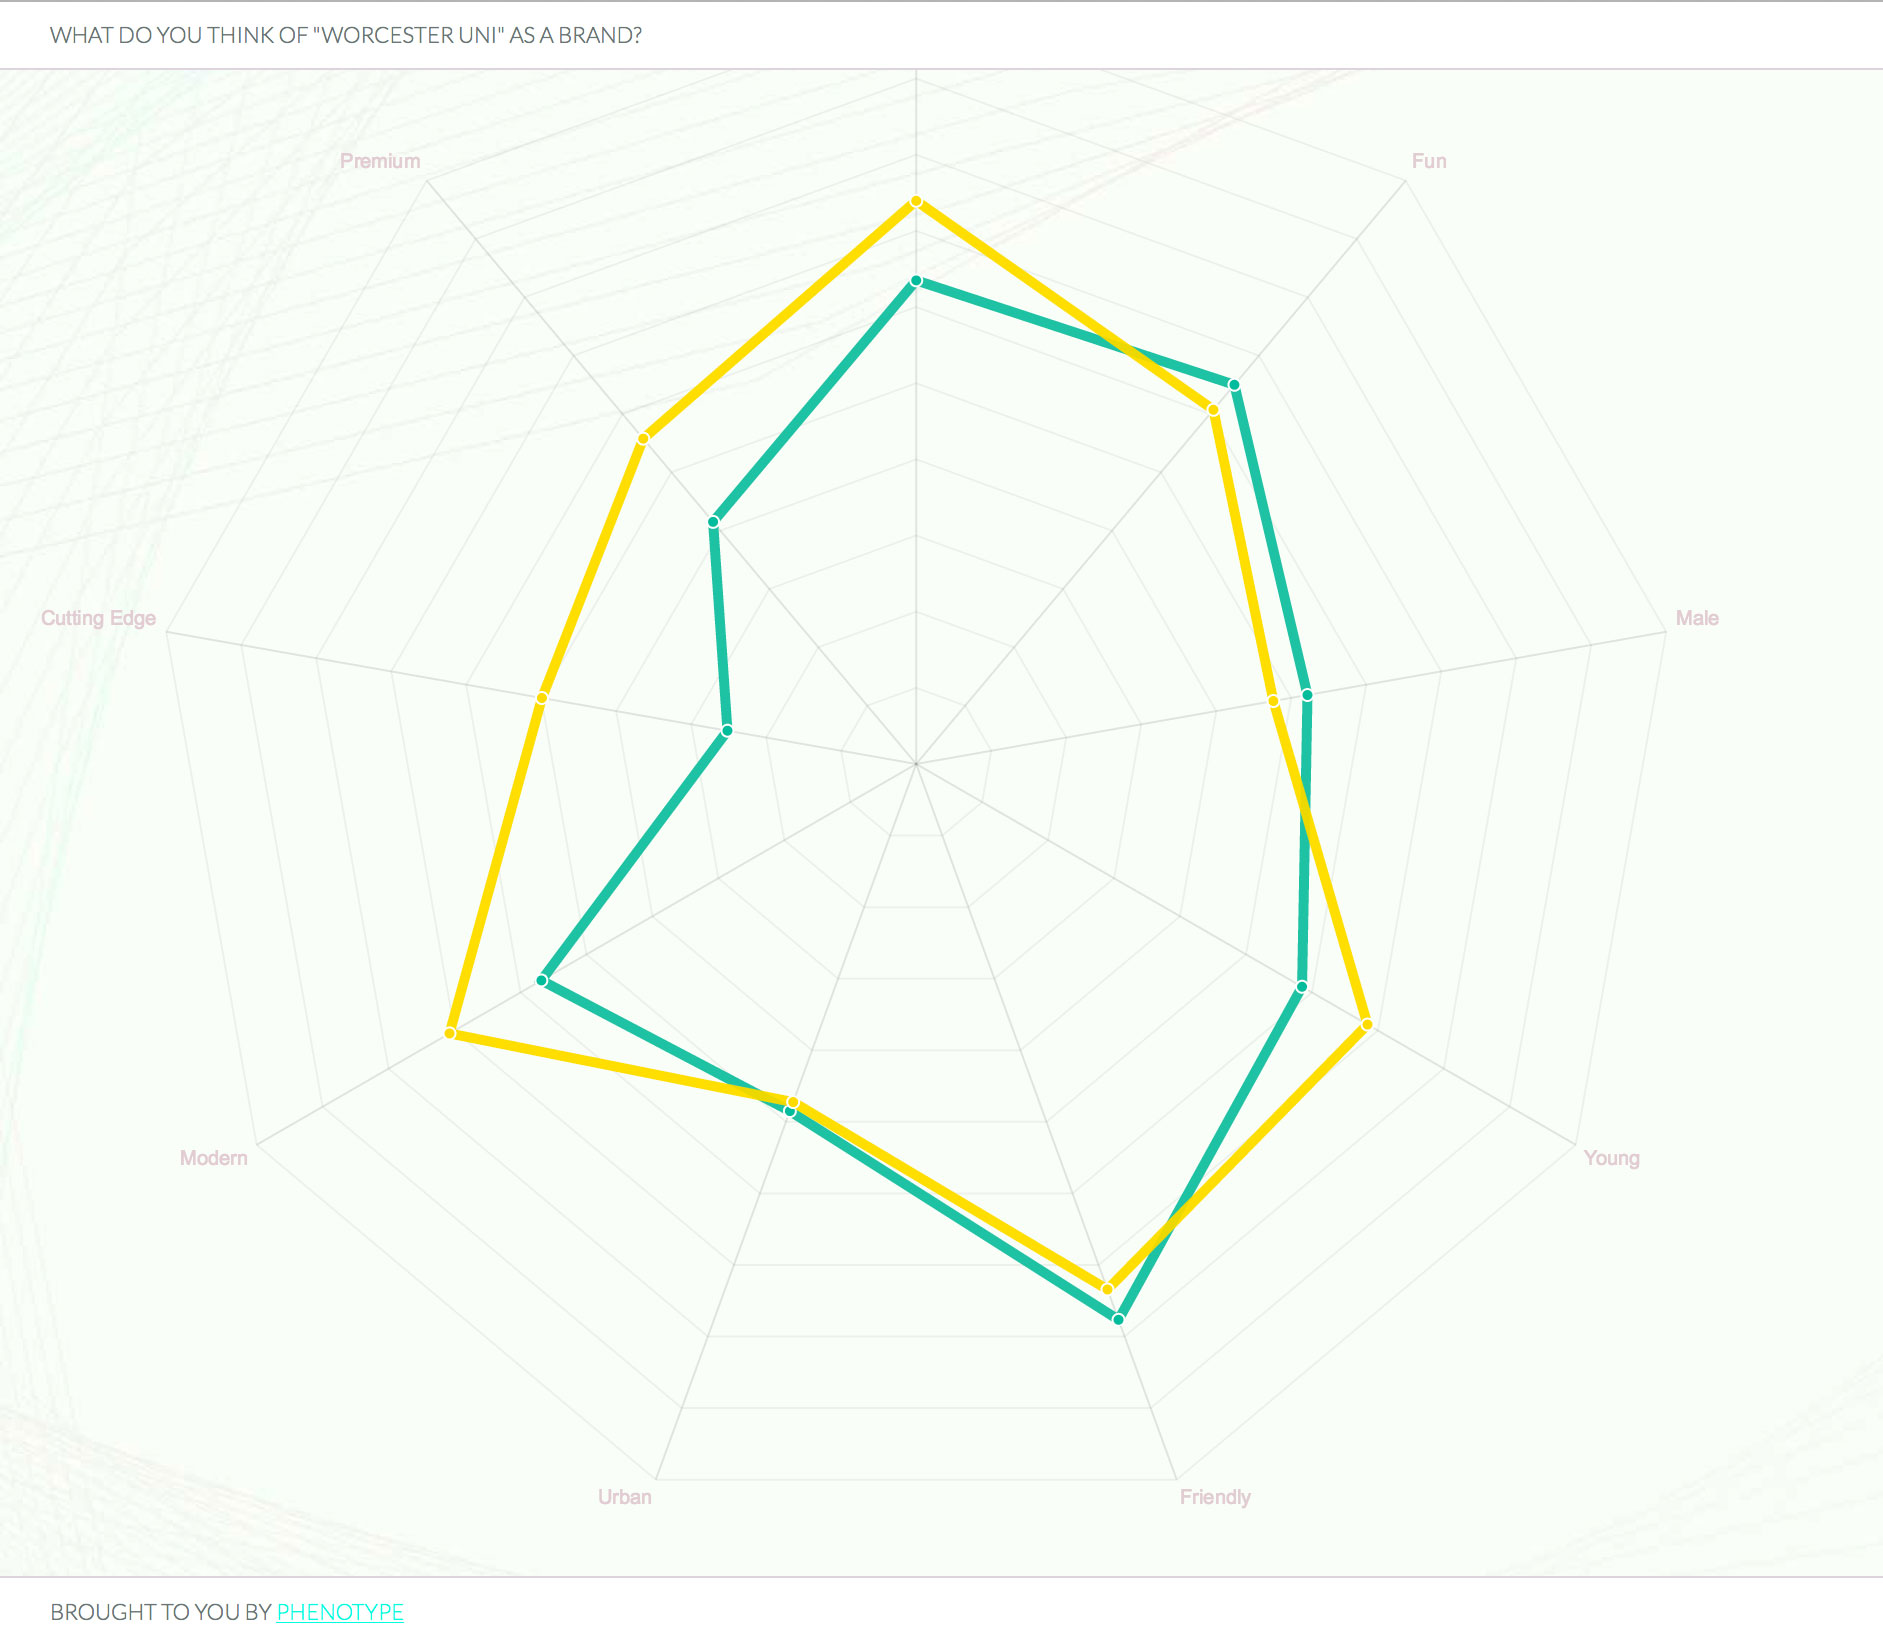
This is interesting and from this spider diagram you can see the similarities but also the “gaps” in perception between the groups.
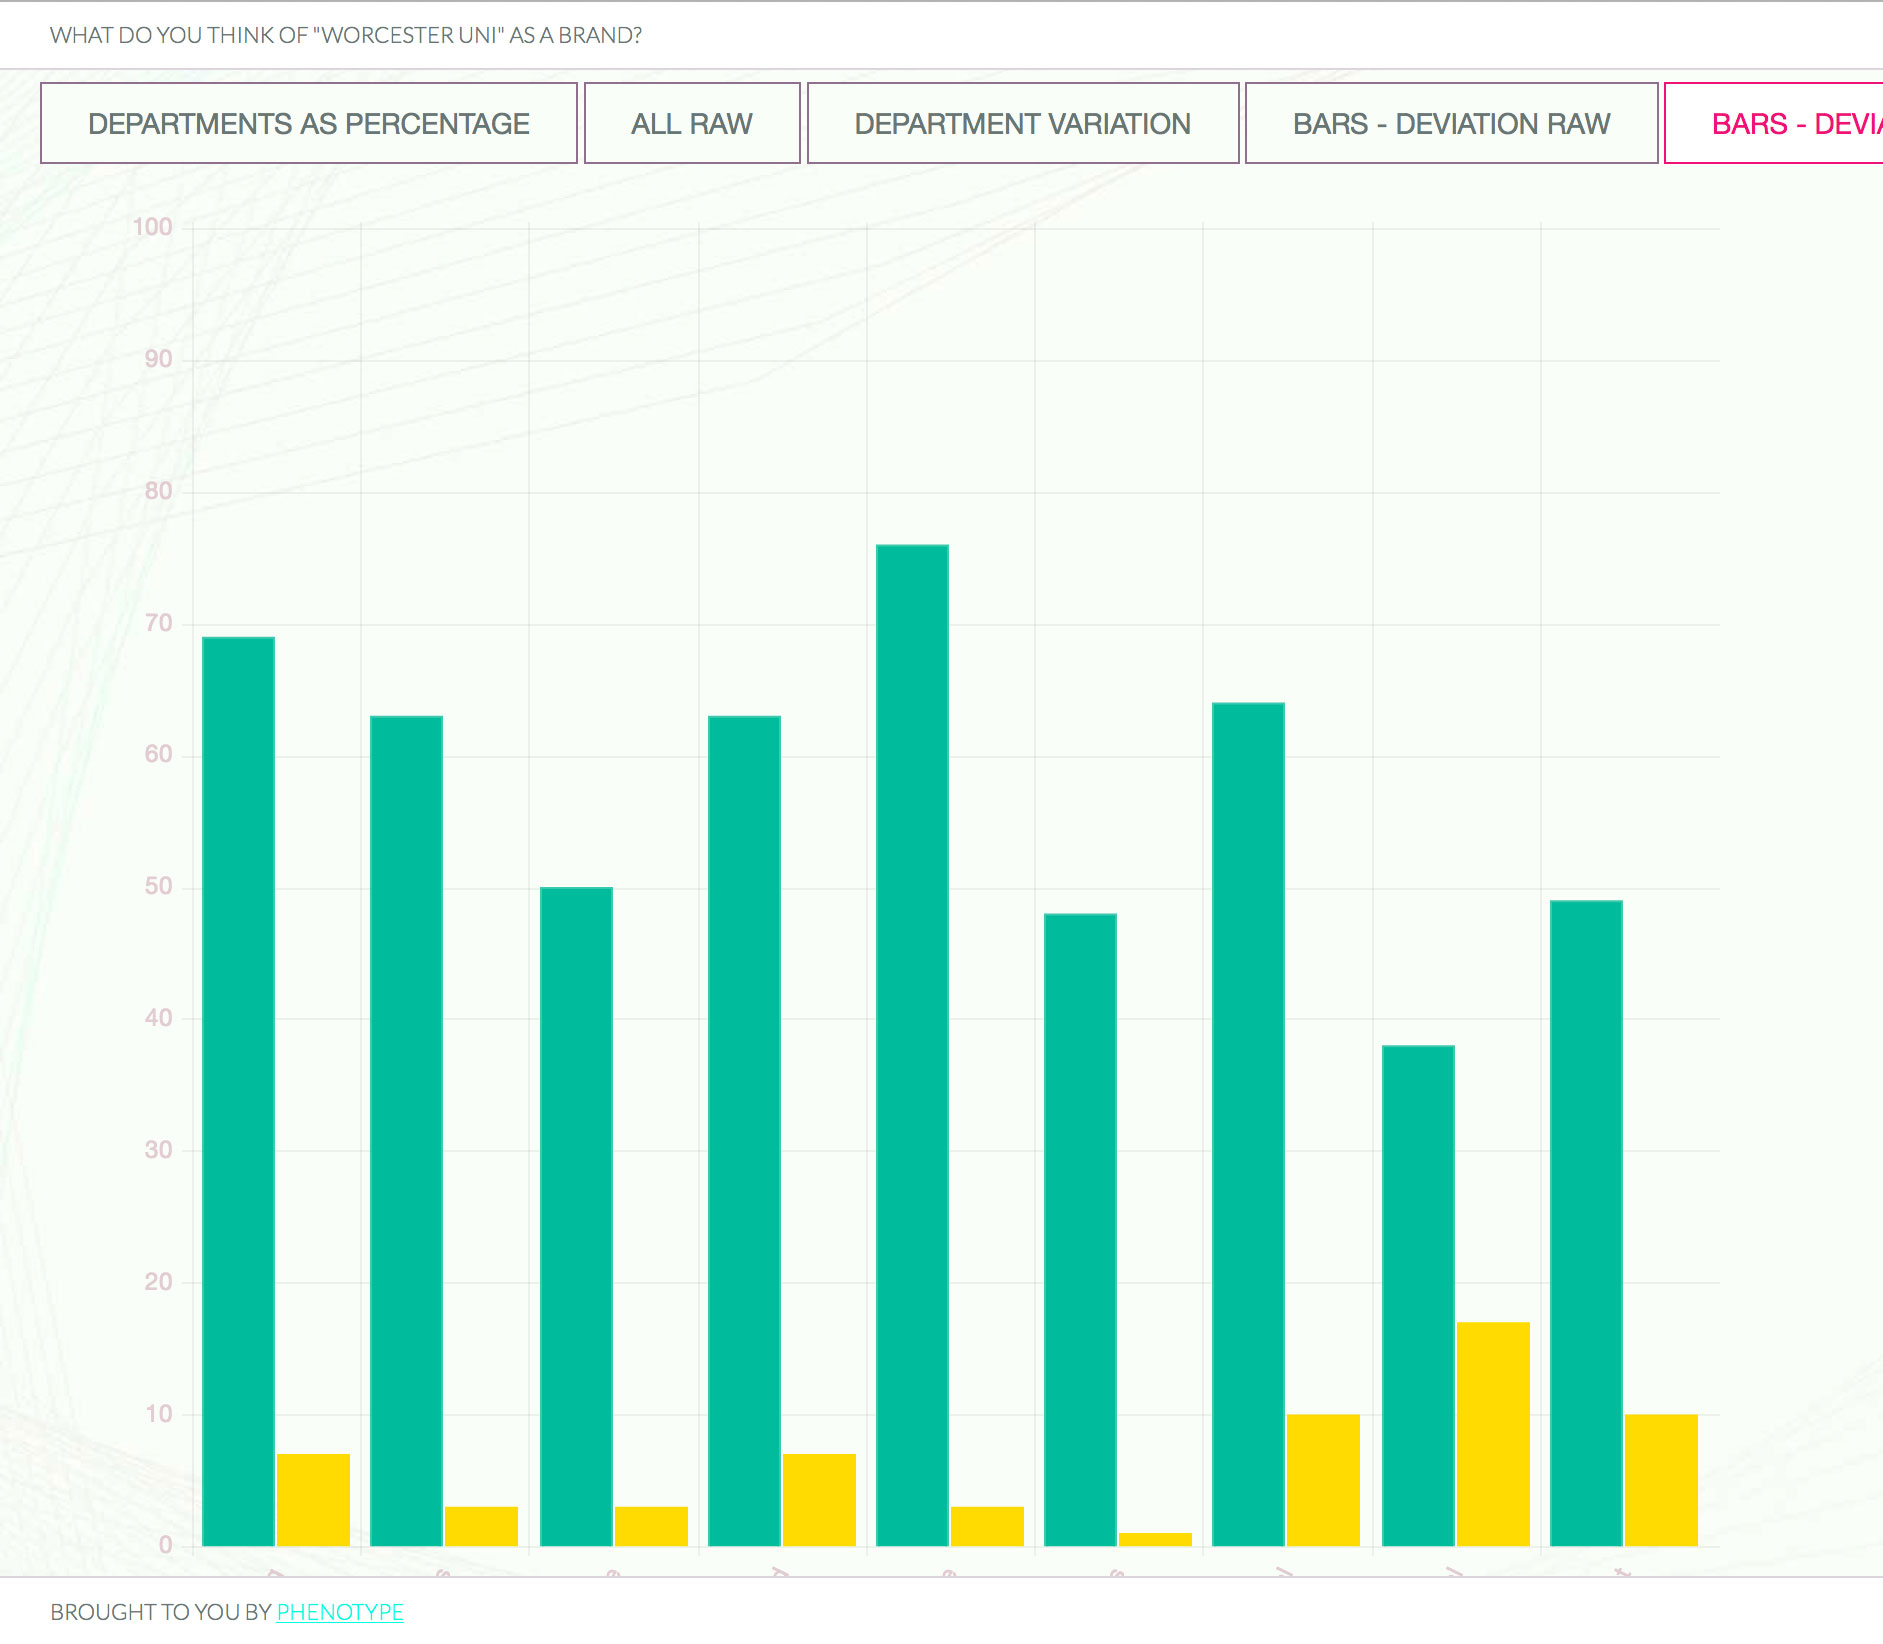
But we can dig deeper using just this data
We can show this graph in a different format
Which shows where the gaps in perception about the brand lie.
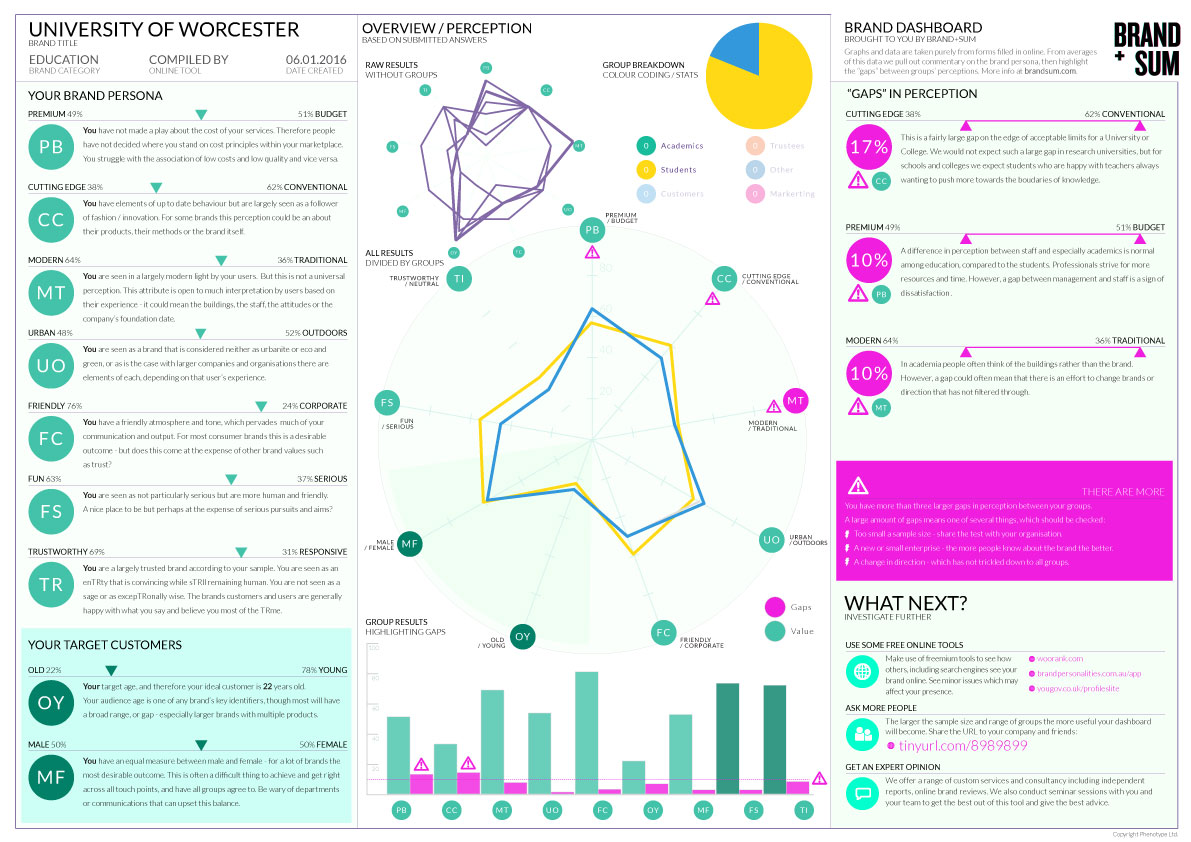
And generate a dashboard of your brand's perception
Showing all the graphs we have seen so far as well as some commentary.
So what you may well ask
And you would be right to.
Even this short example shows (within 2 minutes) how the two groups of people are thinking about the brand.
It is then time to discuss with your colleagues why that might be and if the gap is healthy. But also to discuss the absolute values to see wether this is right. A good next step is to invite more groups and people to add to the survey. So for this example, that we won’t show here, we invited more students and colleagues, and then crucially the management, HR and marketing teams. Again the results were plotted in the same way and the gaps discussed.
A glossary of terms
Binary Attributes
The sliders we use definer, for us, what you think about a brand. These are the human-led data we use.
Gaps
We define a gap as a difference in perception among groups. To err is human, so above 10% counts as a gap.
Brand
A brand is anything with a logo – A company, a shop, a product or as is usually the case a trading name.
Input
The only input for the data shown is the 9 sliders, plus a radio selecting the group which the user belongs to. And the input is only from the people you have sent your URL to. All data is anonymous but there are limits to this – if there are two people in a group it is not hard to work out which is which.
Test your Brand's perception now
Did we mention this is a FREE to use service. If you want to get our advise on something, run a session with your team or you want to edit the questions, then we can help.